Kaalfontein shows how fast wetlands fail when cities lack data. Here’s how AI-driven monitoring and risk models can protect water systems while planning housing smarter.
AI Urban Planning: Protect Wetlands, Build Homes
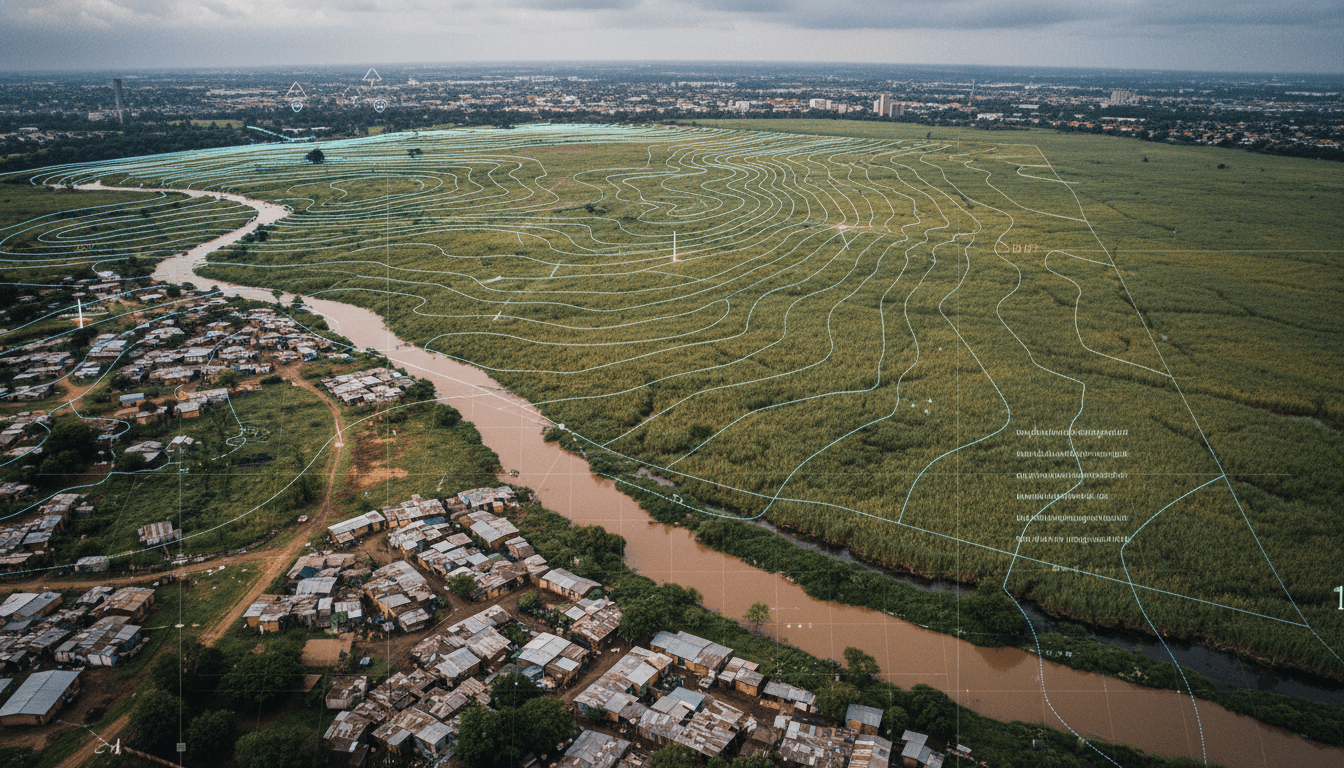
December in Gauteng is when the rain stops being “nice-to-have” and starts testing every bad planning decision. When water has nowhere safe to go, it goes where it always does: downhill, into homes, across roads, and straight through communities that can least afford the damage.
That’s why the Kaalfontein wetland story isn’t “just” an environmental story. It’s a data story, a service-delivery story, and a digital systems story. A vital spring feeding the Kaalspruit (a source stream in the Hennops River system) is being squeezed by rapid informal settlement growth. Rubble and waste are used to fill and raise wetland ground so structures can be built closer to the stream—shrinking a peat wetland into a degraded channel and pushing families into flood-prone zones.
Most companies in South Africa’s digital economy—online retailers, delivery platforms, fintechs, on-demand services—depend on predictable infrastructure: passable roads, functioning drainage, and stable communities. When wetlands fail, the knock-on effects show up in late deliveries, higher insurance risk, more customer churn, and real human cost. The good news is that AI in South Africa isn’t only about product recommendations and chatbots. The same AI techniques powering e-commerce and digital services can help cities plan, monitor, and respond before “urban pressure” turns into disaster.
Kaalfontein shows what happens when cities run on missing data
The core problem is simple: you can’t manage what you don’t measure, and informal areas are often the least measured places in the city. In Kaalfontein, the visible symptoms—illegal dumping, sewage and plastic entering the Kaalspruit, infilling of wetland areas, erosion along banks—point to a deeper issue: weak, slow feedback loops between what’s happening on the ground and what authorities can act on.
When a wetland is intact, it’s a natural buffer. It stores water, filters pollutants, and slows flood peaks. When it’s filled, narrowed, or cut up by informal building and dumping, it stops behaving like a sponge and starts behaving like a pipe. That shift matters in summer rainfall season because:
- Flood risk rises fast when water is forced into a narrower channel.
- Erosion accelerates where banks are disturbed and vegetation is removed.
- Pollution concentrates when wastewater drains directly into streams.
- Downstream impacts multiply, carrying waste toward already-stressed systems such as Hartbeespoort Dam.
Here’s the stance I’ll take: reactive clean-ups and one-off enforcement don’t scale when settlement growth is constant. South African metros need a monitoring-and-planning layer that updates as quickly as the city changes.
What AI can do that traditional planning struggles with
AI doesn’t “solve housing.” But it can solve three things that keep undermining housing-and-environment decisions: visibility, prediction, and prioritisation.
1) Near-real-time visibility with satellite and drone analysis
A practical use of AI in urban planning is change detection: training computer vision models to compare imagery over time and flag where land cover is changing.
In a place like Kaalfontein, that means automatically detecting:
- New structures creeping into wetland buffers
- Fresh dumping/infilling hotspots (rubble piles, soil movement)
- Vegetation loss along riverbanks
- New informal access routes that often become erosion lines
This isn’t science fiction. The digital services playbook already uses similar techniques—think fraud detection or abnormal pattern detection in payments. The urban version is: spot anomalies early, before they become permanent.
If you’re a digital services provider working with municipalities or utilities, a strong starting point is a monthly “risk heatmap” dashboard rather than a massive, multi-year data project.
2) Predictive flood and erosion modelling for micro-areas
Traditional flood models can be expensive and slow to update. AI-assisted hydrology can speed up scenario testing by combining:
- Rainfall patterns and short-term forecasts
- Local topography (elevation models)
- Drainage network condition (where known)
- Land cover changes (from imagery)
The output isn’t a glossy report. It’s a ranked list of blocks/streets most likely to flood, and which interventions reduce risk fastest.
In Kaalfontein’s case, predictive modelling could help answer operational questions that matter to residents:
- If we clear one blocked culvert, which area sees the biggest reduction in flood depth?
- If we restore 50 metres of reed bed, what happens to peak flows?
- Which homes are now inside a 1-in-20-year flood line because the wetland was narrowed?
That’s the shift: from “we know it floods” to “we know where, when, and what to do first.”
3) Smarter prioritisation when budgets are tight
Budgets are always tight. So decisions need to be explicit.
AI can help build a multi-criteria prioritisation model that balances:
- Human safety (flood exposure, disease risk)
- Environmental value (wetland function, biodiversity corridors)
- Infrastructure dependency (roads serving clinics, schools, delivery routes)
- Cost and time-to-impact (what can be done in 30, 60, 90 days)
This is exactly how e-commerce and logistics companies operate: scoring routes, customers, and risk to decide what happens next. City management needs that same clarity.
One-liner worth repeating: If your city can’t prioritise transparently, it will prioritise emotionally—usually after a crisis.
The “hidden data problem” in informal settlements (and how to fix it)
Informal settlements often sit outside the neat datasets: incomplete address systems, inconsistent service records, and weak reporting channels. That makes it harder to plan sanitation, waste removal, and stormwater protection—creating the very pollution seen along the Kaalspruit.
A realistic, South Africa-friendly approach is to combine three data streams and let AI reconcile them.
A workable data trio
- Remote sensing data (satellite/drone): objective land change, water presence, dumping indicators.
- Low-friction community reporting: WhatsApp-based reporting, voice notes in local languages, USSD for basic phones.
- Operational data from service teams: waste pickup logs, sewer callouts, clinic diarrhoea case spikes (where appropriate and privacy-safe).
Then apply AI to:
- De-duplicate reports (same dump site reported 50 times)
- Auto-classify issues (sewage leak vs dumping vs flood blockage)
- Route to the right department/vendor
- Track closure time and repeat offenders/locations
For digital service providers, this is familiar territory: ticketing automation, customer support triage, and workflow routing—adapted for city operations.
What businesses can learn from Kaalfontein (yes, even e-commerce)
If you’re reading this as an online retailer, marketplace operator, delivery business, or digital payments provider, it’s tempting to see wetlands as “government stuff.” That’s a mistake.
1) Your last-mile performance depends on ecological infrastructure
Wetlands, rivers, and stormwater systems are part of the real infrastructure your drivers and customers use. When flooding increases:
- Delivery windows slip
- Return rates rise (missed deliveries)
- Vehicle damage and maintenance costs climb
- Customer support load spikes
AI for e-commerce in South Africa often focuses on conversion rate optimisation. Add climate-and-flood resilience to the roadmap if you want stable operations.
2) ESG isn’t a PDF—AI makes it measurable
Many companies publish ESG commitments, but struggle to prove local impact. Monitoring a wetland corridor with AI-based change detection provides:
- Measurable indicators (dumping hotspots reduced, vegetation restored)
- A clear baseline and trendline
- Auditable intervention logs (clean-ups, litter traps, rehabilitation)
It’s also reputationally safer than vague claims.
3) Partnerships work better with shared dashboards
Environmental groups in the Kaalfontein area have done years of clean-ups and reporting. The persistent issue is continuity and accountability. Shared dashboards—even simple ones—create common ground between:
- Community organisations
- Municipal departments
- Private waste contractors
- Nearby businesses and landlords
When everyone can see the same queue of problems and closure rates, it’s harder for issues to disappear into bureaucracy.
A practical “AI + wetland” playbook for SA metros
If you’re building or buying digital services for municipalities, property groups, or large last-mile operators, start with a tight scope. Here’s what works in the real world.
Step 1: Map and agree the buffer zones
Define no-build and high-risk zones around streams and wetlands using elevation + historic flood extents. Make it visual and easy to understand.
Step 2: Set up automated change alerts
Run monthly (or biweekly) imagery comparisons and trigger alerts when:
- Structures appear inside buffers
- Infilling expands
- Vegetation drops sharply
Step 3: Add a community reporting layer
Keep it simple: location + photo + category. Reward consistency with feedback (“we received it”, “it’s scheduled”, “it’s closed”).
Step 4: Predict and pre-position before storms
Use rainfall forecasts + local risk maps to pre-position:
- Sandbags / barriers
- Clean-up teams to clear blockages
- Temporary sanitation support where overflow is likely
Step 5: Measure outcomes, not activity
Track:
- Flood incidents per storm event (not per year)
- Dumping recurrence rate per hotspot
- Time-to-close for sanitation and waste tickets
- Water quality proxy indicators (where measured)
This is the same shift e-commerce made years ago: stop reporting effort, start reporting impact.
People also ask: can AI really help without formal services?
Yes—if AI is used to target service delivery, not replace it. AI can’t substitute for toilets, waste collection, or safe housing. What it can do is reduce waste in the system: fewer blind spots, faster response, and better sequencing of limited resources.
Will AI worsen surveillance concerns in informal settlements? It can, if implemented carelessly. The safe baseline is:
- Use aggregate, area-level risk scoring (not person-level tracking)
- Keep reporting voluntary and transparent
- Separate operational service data from law-enforcement use unless legally required
- Apply strong governance: data minimisation, retention limits, audit logs
If your AI system can’t explain what it collects and why, don’t deploy it.
Where this fits in South Africa’s AI-for-digital-services story
This series often talks about AI for marketing automation, customer engagement, and operational efficiency in South Africa’s online economy. Kaalfontein is a reminder that the same AI capabilities also belong in the physical city—because digital services don’t float above real streets, real drainage, and real public health.
The reality? Building dignified housing close to jobs and protecting wetlands isn’t a “choose one” problem. It’s an execution problem. And execution improves dramatically when you can see changes early, model risk before storms hit, and coordinate responses across multiple teams.
If you’re a retailer, logistics operator, property group, or civic tech provider, the next step is straightforward: pick one corridor (a stream, wetland, or flood-prone catchment), stand up a monitoring dashboard, and prove reduced incidents over one rainy season. Then scale.
The question that matters for 2026 planning cycles is blunt: will South African cities keep managing wetlands with after-the-fact clean-ups, or will we build the data systems that prevent the next Kaalfontein?