CNY land checkpoint delays can hit 3 hours. See how AI forecasting and queue-style operations planning help Singapore teams protect SLAs and customers.
AI Forecasting for CNY Checkpoint Traffic in Singapore
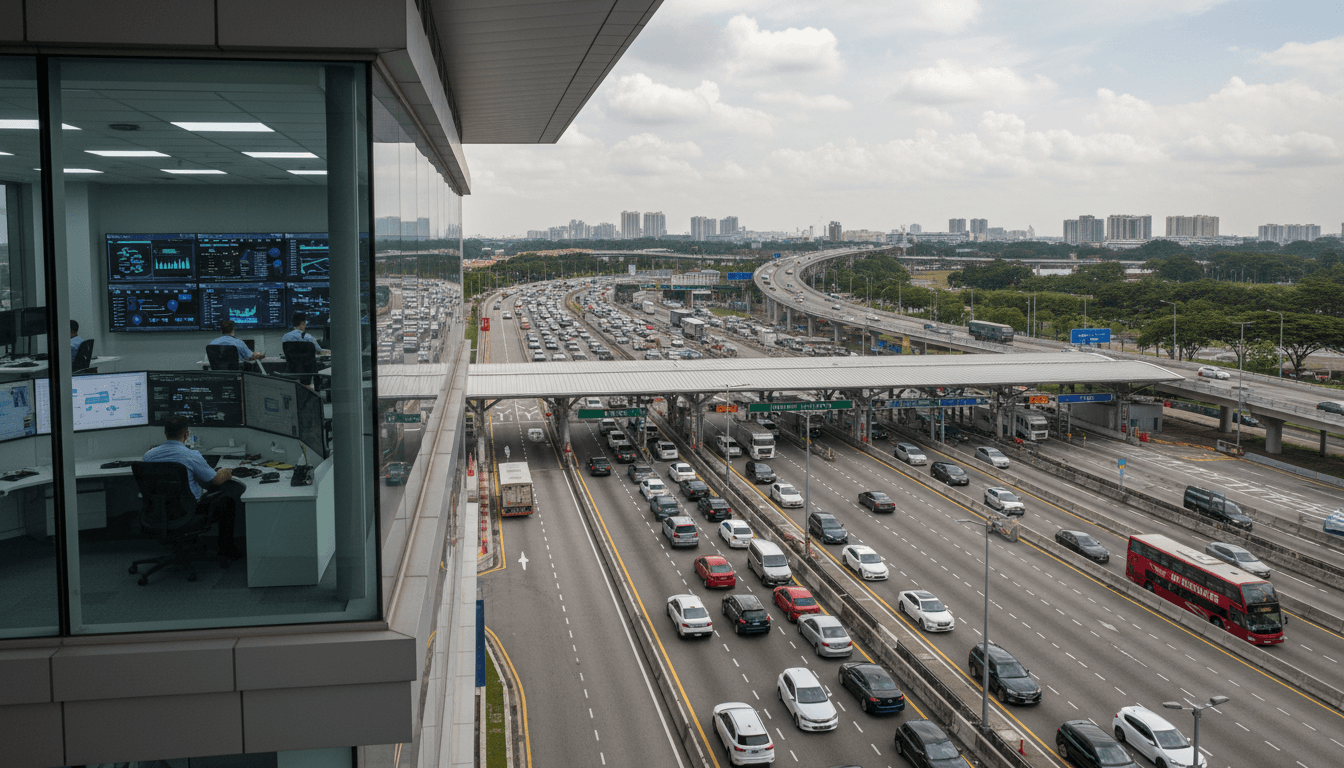
More than 22 million travellers crossed Singapore’s Woodlands and Tuas land checkpoints during the year-end school holidays (Nov 21 to Jan 1). On Dec 19, 2025, crossings hit over 588,000 in a single day, a new record. And car travellers who chose peak hours waited up to three hours for immigration clearance because queues on the Singapore side were pushed by traffic tailbacks from Malaysia.
Now zoom in on the next peak: Chinese New Year (CNY) travel from Feb 13 to 23, 2026, with CNY falling on Feb 17 and 18. The Immigration and Checkpoints Authority (ICA) is already warning travellers to expect very heavy traffic—and not only because of volume. Clearance may slow due to intensified checks targeting contraband such as e-vaporisers, firecrackers and bak kwa.
For travellers, this is a planning headache. For businesses—especially logistics, retail, F&B, transport operators, and companies with cross-border operations—it’s an operational risk. In this edition of our “AI dalam Logistik dan Rantaian Bekalan” series, I’m taking a clear stance: CNY checkpoint congestion is predictable enough that we should treat it like a forecasting problem, not a “seasonal surprise.”
What ICA’s CNY warning really means for businesses
Answer first: ICA’s warning is a signal of capacity constraints plus stricter inspection regimes, which together create delays that ripple into supply chains and customer experience.
The CNA report highlights three important drivers of delays:
- Demand spikes: Holiday-driven, time-bunched travel (families leaving after work, weekend surges).
- Downstream bottlenecks: Traffic tailbacks from Malaysia can cascade into Singapore lanes.
- Process variability: Increased enforcement checks add variability to clearance time, even if average volumes are “manageable.”
If your operations involve any of these, the impact shows up fast:
- Delivery windows get blown (especially same-day or time-slot deliveries).
- Customer service load increases (status checks, complaints, refunds, rescheduling).
- Labour costs rise (overtime, reassigning drivers, surge staffing).
- Inventory planning becomes noisy (stores near demand hotspots run out, others overstock).
This matters because queueing problems don’t fail gracefully. A small increase in arrival rate near capacity can create disproportionate waiting time increases—the classic “everything was fine until suddenly it wasn’t.”
AI traffic prediction: the practical way to reduce operational chaos
Answer first: You don’t need a futuristic “smart city” build to get value—most Singapore businesses can start with predictive demand + ETA modelling using the data they already have.
ICA advises travellers to check traffic conditions via sources like OneMotoring and ICA’s social channels, and encourages use of MyICA QR codes for more convenient clearance (while still carrying passports). Those tips are useful—but they’re reactive. Businesses can go one step earlier.
What to predict (and why it’s enough)
You’re not trying to predict the exact queue length minute-by-minute. You’re trying to predict risk bands that your operations can act on.
A solid first version of an AI-assisted model predicts:
- Border-crossing delay bands (e.g., low: <30 min, medium: 30–90 min, high: 90+ min)
- Peak-hour probabilities by direction (SG→MY vs MY→SG)
- ETA impact on your routes and service levels
For supply chain teams, that’s immediately actionable: you can shift departures, change handover points, pre-position inventory, or move customers to alternative slots.
Data sources businesses can use (without begging for government data)
Most teams underestimate how much signal they already have:
- Historical delivery timestamps and driver GPS traces
- Customer order patterns around CNY (day-of-week, paydays, promo cycles)
- Publicly available checkpoint traffic updates (as features, not as the whole model)
- Weather proxies (rain often worsens driving speeds and incident rates)
- Calendar features: school holidays, weekends, CNY eve/day 1/day 2, return wave
You can start with straightforward machine learning (gradient boosting, random forests) or even a strong statistical baseline. The win comes from operationalizing it: alerts, dashboards, and dispatch rules.
Snippet-worthy truth: If your dispatch plan doesn’t change when risk changes, your “forecast” is just a report.
Queue management isn’t only for checkpoints—your business has queues too
Answer first: CNY congestion creates secondary queues—call centre backlogs, WhatsApp inquiries, rescheduling piles—and AI can manage those with the same logic as traffic flow.
When border delays spike, customers don’t complain about border theory. They complain about your delivery, your appointment, your missed slot.
Where AI helps immediately in customer operations
In peak periods, I’ve found it’s not the delay itself that kills experience—it’s uncertainty and slow response.
A practical AI stack for customer service during CNY includes:
- Real-time triage and intent routing (delivery status, reschedule, refund, customs questions)
- Auto-generated proactive updates when ETAs cross a threshold
- Agent assist to summarize case history and recommend next actions
- Dynamic FAQ that updates based on the day’s top issues (e.g., “Causeway delay today is high; here are revised cut-off times”)
This is especially relevant for businesses serving customers near the North and West corridors, or handling time-sensitive deliveries (fresh food, festive gift baskets, catering).
A simple playbook for “uncertainty reduction”
Even without deep AI, you can design better communication rules:
- Set honest service promises by risk band (don’t overpromise during Feb 13–23).
- Push proactive notifications at fixed checkpoints (order packed, dispatched, reached border, cleared border).
- Give customers a choice: switch to a later slot, pick-up point, or alternative fulfilment method.
AI makes this scalable by automating detection (risk) and action (message + option).
Logistics and supply chain actions that work during Feb 13–23
Answer first: The best CNY strategy is to move work away from the bottleneck—either in time (depart earlier) or in method (change mode of transport).
The CNA report notes ICA’s suggestion: travellers who must travel during peak can consider cross-border bus services to avoid congestion. Businesses can borrow that thinking: mode shifts and process shifts are legitimate tools.
1) Shift from “just-in-time” to “just-in-case” for a few days
CNY week isn’t when you run the thinnest safety stock. It’s when you protect your most profitable SKUs.
- Pre-position fast movers in Singapore before the heaviest outbound wave.
- For Johor-side operations, pre-stage returns or replenishment ahead of the return wave.
2) Rebuild routing around border uncertainty
If your routes assume the border is a predictable segment, your plan will collapse.
- Build routes with buffer rules tied to predicted delay bands.
- Use handover points (swap drivers/vehicles) to reduce idle time.
- Prioritize loads by perishability and service penalty.
3) Use cut-off times that respond to reality
Static cut-off times fail during peak seasons.
A better approach:
- When risk band is “high,” auto-advance cut-off times (e.g., order by 11am, not 2pm).
- Offer customers incentives for off-peak slots.
4) Treat compliance checks as part of lead time
ICA highlighted intensified checks for contraband (including e-vaporisers and firecrackers). Whether or not your business touches these categories, enforcement surges can slow everyone.
So your planning assumption should be:
- Higher variance in clearance time.
- More value in documentation readiness and “no surprises” packaging.
What an AI “checkpoint-risk dashboard” looks like (and how to build one fast)
Answer first: A useful dashboard combines forecasted risk, current signals, and recommended actions—not just a map with red lines.
If you manage logistics, dispatch, or operations in Singapore, this is a strong 2–4 week build for a small team.
Minimum viable dashboard (MVD)
Include these panels:
- Today + next 7 days risk (AM/PM, direction-specific)
- Impact on routes (which deliveries are at risk of breach)
- Operational recommendations (depart earlier by X, reassign to route Y, switch to pick-up)
- Customer comms trigger list (orders needing proactive updates)
Model outputs that teams actually use
Keep outputs decision-shaped:
- “High risk of >90 min delay at 5–9pm Fri”
- “Reschedule 34 orders in Zone A to next-day AM to keep SLA >95%”
- “Add 1 standby vehicle for West corridor between 2–6pm”
This is where AI business tools pay off: they turn a messy, public problem (border traffic) into internal reliability.
People also ask: do QR codes and buses change the equation?
Answer first: They help at the margin, but the bigger win is planning around predictable peaks.
- MyICA QR codes can make individual processing more convenient, but travellers still face lane congestion and overall volume constraints.
- Cross-border buses can reduce the pain for individuals and staff commuting, especially when private car queues are worst.
- For businesses, neither eliminates the need for forecasting, buffers, and proactive customer comms.
If you’re deciding where to spend effort before Feb 13–23, start with forecasting and operational triggers. Then add channel/mode shifts.
What to do next (if you operate in Singapore)
CNY checkpoint congestion is a reminder of a broader supply chain truth: constraints move around, but they never disappear. In our “AI dalam Logistik dan Rantaian Bekalan” series, we keep coming back to the same idea—use AI where variability hurts most: ETAs, demand, and service load.
If your team is still running peak-season operations off gut feel and WhatsApp updates, you’re paying for uncertainty twice: once in overtime and once in customer churn.
Here’s a practical next step: map your last 30 days of deliveries and identify where border delay caused knock-on failures (late deliveries, reschedules, refunds, call spikes). That becomes your training data for an AI model—and your blueprint for an operations dashboard.
The forward-looking question worth asking before the next holiday surge: are you managing border congestion as “news,” or as a measurable, forecastable input to your supply chain?
Source reference: CNA report on ICA’s advisory for heavy traffic at Singapore land checkpoints during Feb 13–23, 2026.